
By SDGCounting
Halfway to 2030, progress on the Sustainable Development Goals might be better than you think.
If you only heard one statistic about the Sustainable Development Goals in the past year, we’re pretty sure it was at the midpoint of the 2030 Agenda only 15% of the targets are on track. But for a framework that includes 17 Goals, 169 Targets, and 231 Indicators, how well does this single statistic represent the international community’s progress in achieving the Global Goals?
While technically accurate and certainly concerning, it unsurprisingly doesn’t tell the whole story. In fact, using the same data that produced this widely circulated statistic, we find a lot to celebrate.
In this article we break down the data behind the 15% figure and why there is still reason for optimism.
A Grim Assessment of Progress on the SDGs
Secretary-General António Guterres made headlines at the 78th UN General Assembly by opening the SDG Summit with a concerning tone claiming only 15% of the targets were on track to be met by 2030.
Experts have long known we are lagging on achieving the Global Goals — a fact compounded by the recent polycrisis of COVID, conflict and climate — but 15% at the halfway point seems particularly dismal.
This prompts the question: Where did this statistic originate, and does it accurately depict the years of work and billions of dollars spent on development since 2015?
The short answer is that while there is solid evidence the majority of targets are off-track, noteworthy progress is still being made. In fact, utilizing the same data sources behind Secretary-General Guterres statement, we can also see nearly two-thirds of the Global Goals are still attainable despite setbacks.
Where did the 15% statistic come from?Discussion about only 15% of SDG targets showing acceptable progress first surfaced in July 2023, following the release of the Sustainable Development Goals Report. This annual report aims to summarize trends and emphasize key findings derived from over 1 million observations in the official SDG Global Database.
At the end of the introductory section outlining SDG progress to date, we find this graphic on page 11.

Ironically, even though this may be the most frequently cited global statistic of 2023, it’s only mentioned in this one place in the entire 80-page document.
Digging deeper into the mountains of SDG related documents available, we find this statistic is fully fleshed out in the 2023 Progress Chart where every one of the 169 targets has been graded based on strict methodology:
Progress Chart — Sustainable Development Goal Indicators
According to the documentation, indeed, only 15% of targets are “On Track.” However, should the narrative around the SDGs at this halfway point be entirely negative?
What does the underlying data actually say?
The first indication that there’s more to this story might be found in the goal-by-goal breakdown included in the Progress Chart:

At the top we see the same chart found in the SDG Report, but below it we find a more nuanced version that provides a breakdown by goals and some subtle changes to the visualization. First, we see there is actually a fourth category for “Insufficient data”. Next we see that the targets ranked in yellow are described as “Fair progress, but acceleration needed.” This stands in contrast with the more widely cited description of “moderately or severely off-track.”
But which assessment is correct? The technical note accompanying this chart explains that targets are evaluated based on “how likely we are to meet the target by 2030.” Those rated with a score of 2 (yellow) are described as:
[Exhibiting] fair progress, but acceleration needed
“To date there has been some progress towards the target, but moderate or significant acceleration is needed to achieve the target by 2030.”
By comparison, those with a score of 1 (red) are:
[Exhibiting] stagnation or regression:
“To date there is either minimal progress or regression from the baseline, and the target is unlikely to be achieved by 2030.”
Utilizing the same data sources that led Secretary-General Guterres to state that only 15% of the SDGs are on track, we can also assert that:
At the halfway point of the 2030 Agenda, despite setbacks, 63% of the Global Goals are still within reach!
Considering the ambitious nature of the Sustainable Development Goals, this represents a significant accomplishment. Perspective and positioning indeed play crucial roles.
A note about “insufficient data”: As an organization committed to tracking the measurement and reporting of the SDGs, it’s disconcerting to find that 18% of targets still lack sufficient data. However, that’s a topic for another discussion.
What’s going on with the “yellow” targets?
A challenge in managing development data is that the more we simplify our assessments for easier comprehension, the more we distance ourselves from the stories and people behind these numbers.
Thankfully, some of the texture can be reclaimed by taking the time to dig deeper.
Let’s take Goal 1 — No Poverty for instance. The 2023 Progress Chart indicates it is one of six goals where none of the targets are currently on track. Does this mean our efforts have been for naught? Absolutely not!
In addition to the yearly summary, the progress chart, and the thousands of data observations available for each goal, we also have extended reports available for each of the 17 SDGs:
Extended Report – Sustainable Development Goal Indicators
For Goal 1, this is a 9 page document containing additional information about each of indicators provided by the custodial agency responsible for gathering the data. In short, it is a platform where experts, who are most familiar with the data, can offer their insights on the underlying developments.
Target 1.1 is “By 2030, eradicate extreme poverty for all people everywhere, currently measured as people living on less than $1.25 a day” — an ambitious target for sure.
According to the progress chart, this is a “yellow” indicator and while experts claim “ it very unlikely that extreme poverty will be eradicated by 2030” we also can see the monumental strides that have been achieved in the last 20 years:
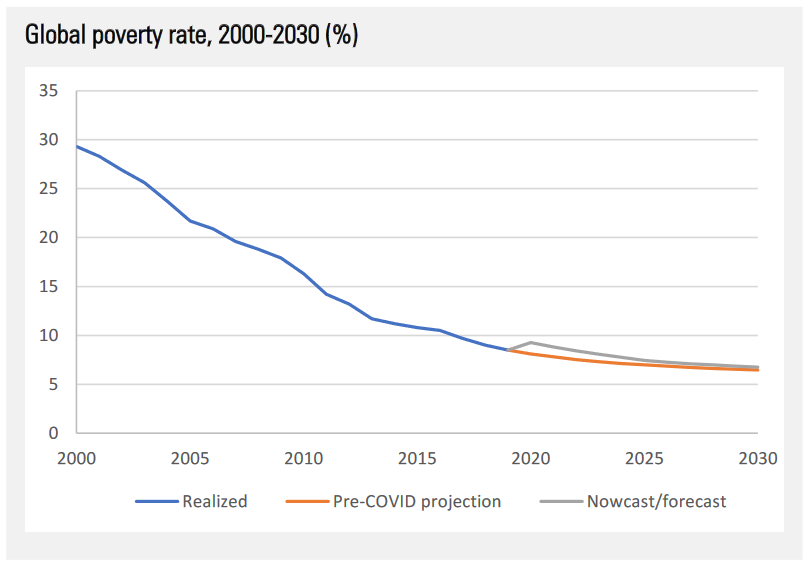
Although we may not fully meet the target, we are on course to reverse the setbacks caused by COVID-19 and are approaching an international poverty rate that is one-fifth of what it was just a few decades ago.
Indicator 1.2 — reducing at least by half the proportion of men, women and children of all ages living in poverty — is also graded as “yellow” but exhibits encouraging trends.
Over the last 10 years, 73% of countries have witnessed a decrease in their national poverty rates, with a third of these countries having already halved their rates. Even more encouraging is the fact that the regions making the most progress are Asia, Africa, and Latin America — areas where poverty has historically been the highest.
Although we might miss these targets by the 2030 deadline, it is encouraging to see the improvements in the quality of life that millions of people are experiencing as a result of our investments.
Conclusion
Motivating the global community to invest in international development always requires advocates to walk the line between demonstrating need and providing hope.
We believe the somber picture painted by Secretary-General Guterres and the UN establishment as a whole was designed to encourage investment and prompt renewed commitment to the second half of the 2030 Agenda. As we head into 2024, we feel it is important to celebrate the accomplishments even when it is likely we will miss fully attaining our most ambitious goals.
While there are reasons for disappointment in our mid-term assessment of the SDGs, we can find inspiration in the words of Martin Luther King Jr.:
We must accept finite disappointment, but never lose infinite hope.
We hope that the global community continues to exhibit optimism and resilience, even when faced with challenges.